


Climate Change: Risks - Business Resilience
Our Approach to Mitigating Market Risks
Marathon Oil’s portfolio and corporate strategy is informed by our assessment of the competitive environment for energy and longer-term oil and gas fundamentals.
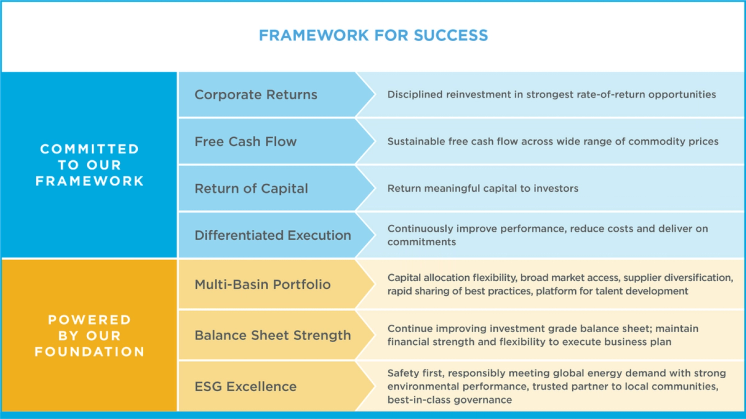
We take proactive steps to mitigate risks and uncertainties associated with climate change and market forces, including the potential for lower future commodity prices and the potential for a future cost on carbon emissions. This includes ensuring our capital expenditure program is resilient; actively managing and maintaining a high-quality multi-basin portfolio; sticking to a disciplined capital allocation framework; maintaining a strong balance sheet; and driving significant GHG emission reductions, all of which are included in our Framework for Success, shown below.
Resilience of our Capital Expenditure Program
We primarily allocate our capital expenditures to high-return, short-cycle, unconventional resource plays. Due to the production profile for the typical unconventional well, the commodity price during the first few years of production has a much greater effect on project economics than longer-dated commodity prices. Most of the wells we drill have short payback periods. In contrast, the primary market risks related to climate change (lower oil and natural gas prices related to declining global demand and/or renewables penetration) are long-term in nature, extending well beyond 2030. Thus the nature of our portfolio and the discipline inherent in our capital allocation framework inherently mitigates the longer-term commodity price risk related to our capital investment decisions (reduces stranded asset risk) and enhances our capital allocation flexibility and ability to respond to changes in the macro environment.
Our short-term planning horizon is two years, and our medium-term planning horizon is five years, consistent with both the short-cycle nature of our portfolio and Securities and Exchange Commission (SEC) rules governing proved reserve bookings. Our long-term planning horizon is 10 years.
We typically disclose a detailed annual plan and budget in the first quarter of every calendar year. We also frequently assess our capital investment program and the robustness of our portfolio over our five- and 10-year planning horizons.
The financial returns and competitiveness of our capital investment program are routinely stress-tested across these time horizons using conservative commodity price assumptions. Projects must meet specific financial targets and/or strategic objectives to be sanctioned.

Active Portfolio Management and High-Quality Multi-Basin Portfolio
We’ve simplified and concentrated our portfolio to improve our competitive positioning. Over the last 10-plus years, we’ve divested higher-cost, higher-risk, lower-margin assets including: Canadian oil sands; Libya; the U.K. and Norway North Sea; Kurdistan; Wyoming; and conventional offshore exploration.
These divestments have lowered our enterprise and regulatory risk, enhanced our financial performance, improved our cost structure, reduced our corporate free cash flow breakeven and lowered our longer-term liabilities (including asset retirement obligations).
Our U.S. resource plays are complemented by our high-quality integrated gas business in Equatorial Guinea, which is highly cash-flow-generative with minimal sustaining CAPEX requirements. Our U.S.-focused unconventional portfolio has less execution risk in comparison to more globally diversified operations. Our low-cost, high-margin U.S. assets also contribute to our low enterprise breakeven, which mitigates our vulnerability to lower commodity prices.
Additionally, the short-cycle nature of our portfolio reduces our “stranded asset” risk and enhances our capital allocation flexibility and ability to respond to changes in the macro environment.
International Energy Agency (IEA) long-term modeling assumptions testify to the global cost competitiveness and resilience of U.S. tight oil production and the advantages of our U.S. resource play portfolio. Under the IEA’s latest Announced Pledges Scenario (which is expected to limit the global temperature rise of 1.7°C in 2100), the global supply of tight oil (approximately 95% of which comes from the United States) is expected to increase by more than 30% from 2021 to 2030 to help meet global energy demand. This is in stark contrast to an expected flattening in total global oil supply over the same timeframe. We believe this is indicative of the advantaged cost structure, profitability and environmental profile of U.S. tight oil production, which is among the safest, most responsible and lowest GHG intensity sources of production globally.
Disciplined Capital Allocation Framework
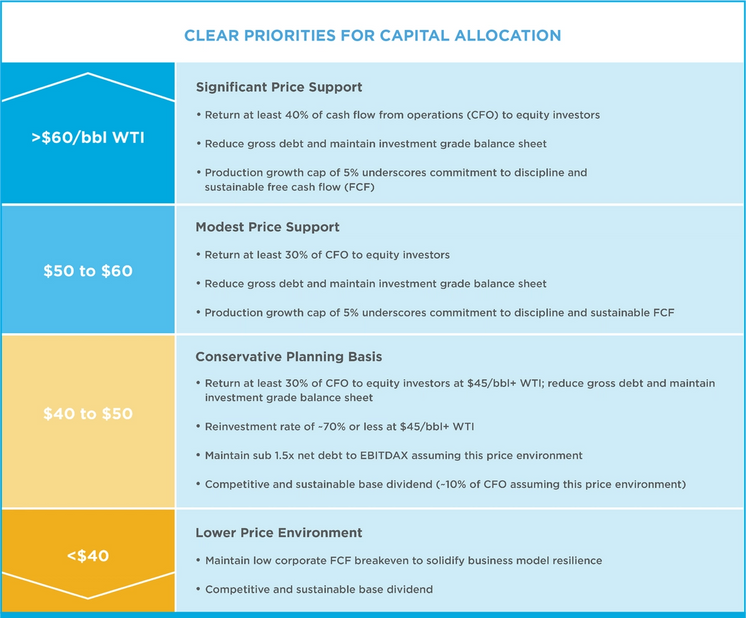
Marathon Oil’s disciplined reinvestment rate capital allocation framework prioritizes strong corporate returns, sustainable free cash flow generation and meaningful return of capital to investors. We believe this capital allocation framework is optimal for a cyclical commodity business and that it appropriately contemplates the longer-term risks and uncertainties associated with climate change and related market forces.

We closely monitor our reinvestment rate, corporate free cash flow breakeven and cash flow per share – all of which are core metrics within our short-term incentive compensation scorecard – as well as the portion of our cash flow from operations that we return to investors. We believe these are tangible metrics upon which investors concerned with longer-term market risk, including lower future commodity prices and a cost on carbon, should be focused.
- Reinvestment Rate: The reinvestment rate represents the ratio of expected capital spending to cash-flow generation. Assuming an oil price of $45/bbl WTI or higher, we target a reinvestment rate of 70% or less of our cash flow from operations. Our reinvestment rate framework instills discipline and competition into our capital allocation framework, enhances our financial returns and protects our ability to generate free cash flow throughout the commodity price cycle. Investing with discipline further reduces the risk that we overcapitalize our business into a potentially more challenging market environment.
- Corporate Free Cash Flow Breakeven: Our corporate free cash flow breakeven represents the oil price necessary to generate cash flow from operations to cover our capital spending. Through ongoing cost structure optimization, disciplined capital allocation and a relentless focus on our capital and operating efficiency, our objective is to maintain our low corporate breakeven and even drive it lower over time. Our focus is consistent with our objective to be the low-cost operator, better positioning us to manage through market environments that could be more challenging in the future.
- Growth in Cash Flow Per Debt Adjusted Share: Our focus is driving per-share growth to the metrics that are most correlated with the value of Marathon Oil.
- Return of Capital: Returning capital to investors is a critical strategic objective and our unique percentage of cash flow from operations model prioritizes our shareholders. Above $60/bbl WTI, our goal is to return at least 40% of our cash flow from operations to our shareholders through the combination of dividends and share repurchases. We believe that a significant return of capital helps mitigate longer-term risks for investors in our sector and promotes our company as a compelling investment within the broader market.
Maintaining a Strong Balance Sheet
Maintaining our strong balance sheet, as evidenced by our investment grade credit rating, is foundational to executing our strategy and enhancing our resilience to market forces. We have a demonstrated track record of conservative financial policy, and we plan to maintain our balance sheet strength through our disciplined capital allocation framework and our conservative leverage targets. A strong balance sheet will help us execute our strategy in a more challenging market environment.
Reducing our GHG Intensity
Driving significant and continuous reductions in our GHG emissions intensity is a core part of our strategy to mitigate the longer-term market risks related to climate change. Intensity metrics are more indicative of our underlying reduction initiatives by normalizing to production levels and provide for more direct comparisons across our peers independent of scale or changes to production levels. Our GHG reduction initiatives are supported by transparent, quantitative objectives intended to promote accountability and ingenuity throughout our organization.
Our target-setting efforts are focused on GHG and methane intensity and our natural gas capture. Further, our disciplined capital allocation framework puts limits on both our capital investment levels and our production growth outcomes. This will contribute to lower absolute emissions over time in comparison to more aggressive production growth initiatives that have historically characterized the E&P industry.
The Role of Long-term Scenario Analysis
This report provides the results of an analysis of the potential impacts to our asset portfolio and business under different scenarios, including the IEA’s Advanced Pledges Scenario (APS) and Net Zero Emissions (NZE) by 2050 Scenario, consistent with TCFD guidance to take into consideration “2°C or lower” global warming scenarios.
Importantly, neither of these scenarios reflects predictions of what is likely to happen or what we believe is likely to happen. Instead, the scenarios are meant to examine the potential effects of several regulatory, economic and societal conditions that could occur. Scenarios should not be confused with solutions. They do not provide a comprehensive description of all possible future outcomes and there can be no assurance that the scenario modeling and assessment presented in this report are reliable indicators of the actual impact of climate change, or efforts to address climate change, on Marathon Oil’s asset portfolio or business. The scenario models and assessments were based on our portfolio as of Dec. 31, 2022, and exclude any changes to laws, regulations or policies that occurred after Dec. 31, 2022. Moreover, the wide range of unpredictable variables and externalities affecting long-term outcomes makes long-term modeling of these scenarios inherently speculative.
Due to the short-cycle nature of our portfolio, our capital allocation flexibility and our limited risk for “stranded assets,” we believe scenario analysis beyond 10 years has limited usefulness for our company. Ipieca’s 2019 awareness briefing (The Role of Scenario Analysis in Climate Reporting) makes a similar point, highlighting the risks of scenario analysis for E&P companies. The briefing states that “companies are valued on proven reserves, which are usually monetized over a shorter horizon than, for example, the extent of the IEA Sustainable Development Scenario, thus indicating that the risk of ‘stranded assets’ is small and unlikely to be indicated by such a scenario.” Similarly, a simple analysis of our market equity valuation relative to our cash flow generation potential at prevailing commodity prices indicates we have limited long-term (10+ years) commodity risk, as the equity market appears to be assigning little to no value to potential cash flows beyond the next 10 years.
Additionally, we are commodity price takers, not price predictors, with no ability to influence the selling price of the global commodities we produce. We believe we should therefore test our business model across a broad range of commodity prices while continuing to enhance our long-term resilience – by driving our enterprise free cash flow breakeven price as low as reasonably possible, maintaining a balanced portfolio and protecting our investment grade balance sheet.
While we understand the significant limitations of longer-term scenario analysis, we still believe it can be a useful tool to inform our strategy, help us better understand how supply and demand dynamics and the market environment may evolve in the coming decades, test the robustness of our strategy and portfolio across different long-term environments and satisfy the interests of certain specialist investors.
We therefore monitor longer-term forecasts and scenarios regarding the potential evolution of oil and gas supply and demand, commodity prices and the potential for a price on carbon. This includes third-party forecasts and scenarios from leading investment banks and energy forecasting agencies including the U.S. Energy Information Administration (EIA), the International Energy Agency (IEA) and the Organization of the Petroleum Exporting Countries (OPEC).
A review of these longer-term forecasts and scenarios highlights the wide range of potential outcomes for oil and gas supply and demand fundamentals and commodity prices over the coming decades. For example, the variance between the highest (EIA High Economic Growth Case) and lowest (IEA NZE) 2040 global oil demand estimates shown in the graphic below is a massive 90 million barrels per day.
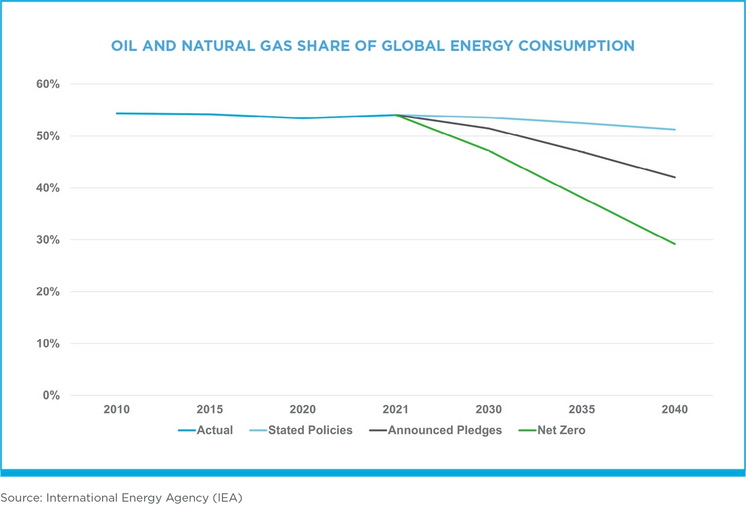
While there are a wide range of longer-term outcomes, most forecasts and scenarios indicate that oil and gas will continue to comprise a significant share of the global energy mix for the foreseeable future – especially those that don’t work backwards from predetermined future outcomes (IEA NZE).

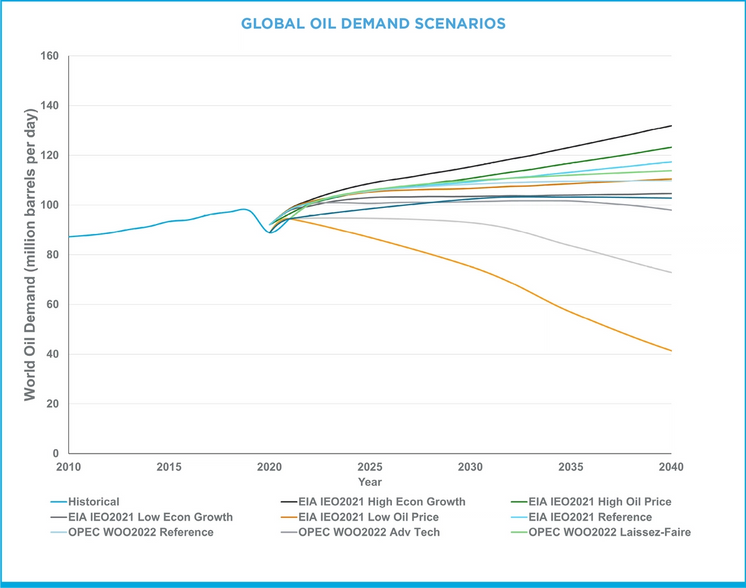
Sources: U.S. Energy Information Administration (EIA), International Energy Agency (IEA) and the Organization of the Petroleum Exporting Countries (OPEC).

Oil and natural gas are foundational to our modern society and way of life. Billions of people continue to live in energy poverty and need access to affordable, reliable energy sources and the global population continues to grow. For all these reasons and more, we concur that reliably, responsibly produced oil and gas are likely to continue to comprise a significant share of the global energy mix through at least 2040. Additionally, U.S. independent E&Ps like Marathon Oil operate with the highest safety and environmental standards in the world and are on the lower end of the global GHG emissions intensity curve. To simultaneously meet global energy demand and reduce global GHG emissions, we therefore need more global oil and gas production sourced from U.S. independent E&Ps, not less. These observations are all supportive of our current strategy and underpin our belief that a group of U.S. E&P companies – positioned at the lower end of the global cost curve and that operate responsibly – will be needed to provide the energy the world needs for continued global economic and social progress.
Reviewing IEA Long-term Scenarios
In conducting our long-term scenario analysis, we leveraged scenarios published by the IEA. The IEA’s World Energy Outlook 2022 (WEO-2022) includes three scenarios, which are summarized below.
- The Stated Policies Scenario (STEPS): This is an exploratory scenario, meaning it does not target a specific predetermined outcome. Rather the scenario establishes different sets of starting conditions and considers where they may lead. This scenario looks not at what governments say they will achieve, but at what they are actually doing to reach the targets and objectives that they have set out. As such, it is based on a detailed sector-by-sector review of the policies and measures that are actually in place or under development in a variety of areas. This analysis assesses relevant regulatory, market, infrastructure and financial constraints. The STEPS reflects a pragmatic exploration of the current policy landscape and gives a view on where the energy system might be heading in the absence of specific new policy initiatives. This scenario is not designed to achieve a particular outcome. Emissions do not reach net zero and the rise in average temperatures associated with the STEPS is around 2.5°C in 2100 (with a 50% probability).
- The Announced Pledge Scenario (APS): This is an exploratory scenario, meaning it does not target a specific predetermined outcome. Rather the scenario establishes different sets of starting conditions and considers where they may lead. This scenario assumes that governments will meet, in full and on time, all the climate-related commitments that they have announced, including longer-term net-zero emissions targets and pledges in nationally determined contributions (NDCs), as well as commitments in related areas such as energy access. It does so irrespective of whether or not those commitments are underpinned by specific policies to secure their implementation. Pledges and initiatives on the part of businesses and other non-governmental organizations are also taken into account wherever they add to the ambition of governments. The APS, first introduced in the WEO-2021, builds on the analysis released during the Glasgow COP26, which demonstrated that the combined implementation of all net-zero emissions pledges and the Global Methane Pledge would lead to a temperature rise of around 1.8°C in 2100 (with a 50% probability). In the IEA’s WEO-2022, the analysis is extended to consider the implications for countries that have not made ambitious long-term pledges but nonetheless benefit in this scenario from the accelerated cost reductions for a range of clean energy technologies. These additional abatement efforts mean that the APS is now associated with a temperature rise of 1.7°C in 2100 (with a 50% probability).
- The Net Zero Emissions by 2050 Scenario (NZE): This is a normative scenario, meaning it works backwards from a predefined net-zero outcome. This normative scenario sets out a pathway to the stabilization of global average temperatures at 1.5°C above pre-industrial levels. It has been fully updated for the 2022 Outlook, so it starts from a higher level of fossil fuel demand and emissions than the version published in the WEO-2021. It also has one year less in which to achieve global net-zero CO2 emissions by 2050. As a result, reaching this goal requires more robust efforts than in the 2021 analysis. The NZE Scenario does this without relying on emissions reductions from outside the energy sector. As in the previous analysis, advanced economies reach net-zero emissions before developing economies do. The NZE Scenario also meets the key energy-related UN Sustainable Development Goals, achieving universal access to energy by 2030 and securing major improvements in air quality.
For our scenario analysis, we specifically focused on the IEA’s APS and NZE, consistent with TCFD guidance to take into consideration “2°C or lower” global warming scenarios.
Yet while the APS and NZE may be appropriate for TCFD-aligned scenario analysis, neither is consistent with our base-case planning forecast and NZE modeling outputs aren’t grounded in prevailing realities and thus appear unrealistic. The NZE approach of back-solving for the predetermined 2050 net-zero outcome results in less credible market and behavioral assumptions at odds with current trends; an unprecedented decoupling in the relationship between population growth, economic output and energy use; and the aggressive deployment of technologies that currently do not exist at scale.
Additionally, we believe an overreliance on the NZE Scenario, which has become a focal point of certain specialist investors, could prove detrimental to both the global consumer and global GHG reduction initiatives. The IEA appears to agree, noting the following in its WEO-2022:
“Reducing fossil fuel investment in advance of, or instead of, policy action and clean energy investment to reduce energy demand would not lead to the same outcomes as in the NZE Scenario. If supply were to transition faster than demand, with a drop in fossil fuel investment preceding a surge in clean energy technologies, this would lead to much higher (commodity) prices – possibly for a prolonged period of time – even if the world moves to net zero emissions. The scope for reductions in fossil fuel expenditure is closely linked to the scale and speed of increases in clean energy expenditure, and to the success of efforts to reduce energy demand: it does not make sense to look at any one of these factors in isolation from the others.”
Scenario Analysis Methodology
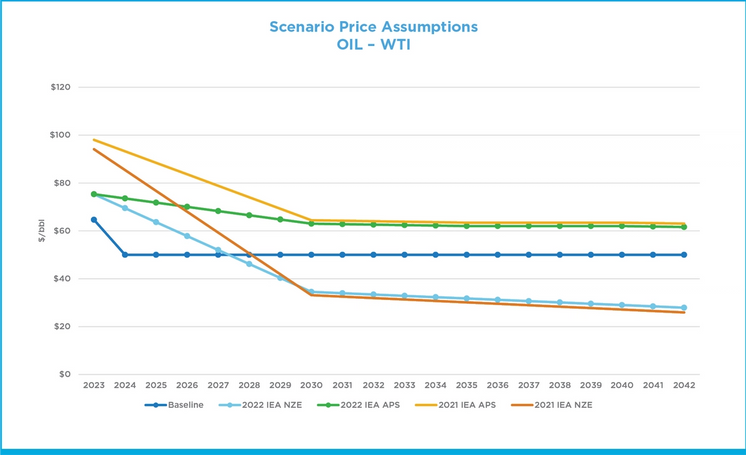
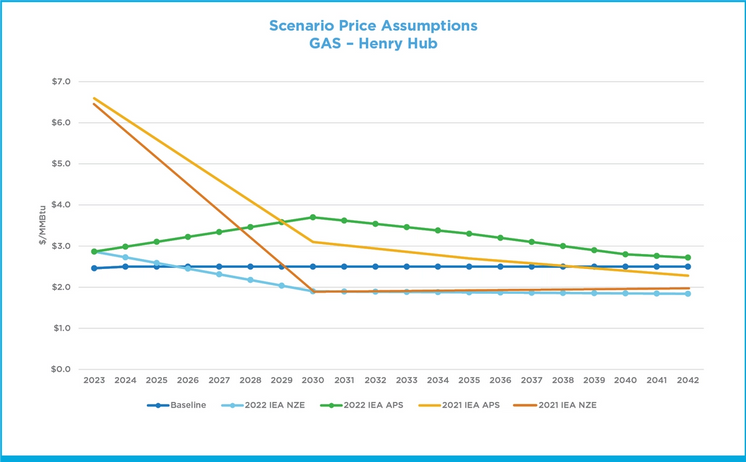
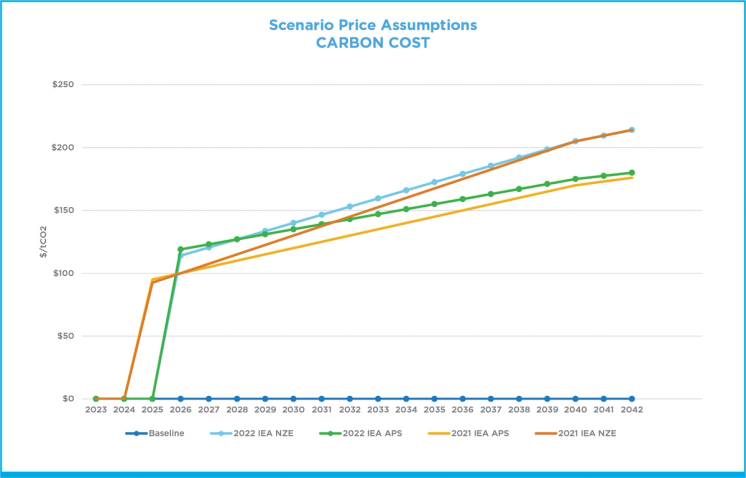
We first established a baseline portfolio value using a non-escalated commodity price deck of $50/bbl WTI for oil and $2.50/MMBtu Henry Hub for natural gas. This price deck is conservative relative to both current and forward curve commodity prices and is consistent with how we routinely test the economic quality of our U.S. unconventional inventory and capital investments. We then added a cost of carbon consistent with the IEA’s APS estimate, a conservative approach, given there is currently no cost of carbon for U.S. producers. This process established our Baseline Scenario.
We then leveraged the IEA APS and NZE forecasts to generate scenarios that test the robustness of our portfolio in a carbon-constrained world. Specific APS and NZE modeling assumptions and outputs are summarized below.
Key IEA APS Assumptions:
- Global Oil and Gas Demand: From 2020 to 2030, global oil and gas demand is relatively flat. From 2030 to 2040, global oil demand declines by approximately 20%. The share of oil and gas in the global energy mix is 51% in 2030 and 42% in 2040 (compared to 54% in 2021).
- Commodity Prices: Crude oil prices average $63/bbl WTI in 2030, holding flat at $63/bbl WTI through 2040. U.S. natural gas prices average $3.97/MMBtu Henry Hub in 2030, declining to $2.80/MMBtu Henry Hub in 2040 (real 2021 dollars).
- Carbon Price: A price on carbon for advanced economies is assessed at $119/tonne by 2026, rising to $200/tonne by 2040 (real 2021 dollars).
Key IEA NZE Assumptions:
- Global Oil and Gas Demand: From 2020 to 2030, global oil and gas demand declines by 20%. From 2030 to 2040, global oil and gas demand declines by an additional 45%. The share of oil and gas in the global energy mix is 47% in 2030 and 29% in 2040 (compared to 54% in 2021).
- Commodity Prices: Crude oil prices average ~$35/bbl WTI in 2030, declining to ~$29/bbl WTI in 2040. U.S. natural gas prices average ~$1.90/MMBtu Henry Hub in 2030, slightly rising to $2.00/MMBtu Henry Hub in 2040 (real 2021 dollars).
- Carbon Price: A price on carbon for advanced economies is assessed at $114/tonne by 2025, rising to $250/tonne by 2040.


We assessed the impact to our net present value and economic resource base by comparing the results from the IEA scenarios to our Baseline Scenario. We also considered the potential impact to planned capital expenditures and remaining asset lives, as well as the potential impact to asset valuations (impairments) and future asset retirement obligations (AROs) as reflected in our financial statements for the year ended Dec. 31, 2022.
Scenario Analysis Observations
Overall, long-term scenario analysis supports our belief that our current strategy and portfolio are both appropriate for the prevailing environment and resilient to a more carbon-constrained future. Yet should the NZE’s post-2030 business environment become more likely, we would take steps to aggressively reduce our costs, improve our efficiencies, capture incremental deflation, and further optimize our portfolio – all of which could help us mitigate potentially negative impacts to our business from lower commodity prices, consistent with our track record during historic down-cycles. None of these potential economic enhancements is included in the scenario analysis.
- Net Present Value (NPV) Of Future Cash Flows: The APS is expected to have a positive impact to the NPV of future cash flows and our assessed economic resource base relative to our Baseline Scenario. Due to the dramatic decline in future commodity prices, the NZE is expected to have a negative impact to the NPV of future cash flows and our economic resource base relative to our Baseline Scenario. However, should the NZE environment become more likely, we would take significant action to mitigate these negative impacts and better manage through the challenging commodity price environment. Such actions would include driving aggressive cost reductions, capturing incremental deflation, realizing efficiencies and optimizing our portfolio. The degree to which we could offset negative impacts from the NZE to our future cash flows and economic resource base, in relation to our Baseline Scenario, is difficult to model.
- Planned Capital Expenditures: The application of IEA APS and/or NZE assumptions and outputs is unlikely to have any material impact to our planned capital expenditures through at least 2030. This is largely because our capital investment program is already conservative, consistent with our disciplined framework that prioritizes free cash flow generation over production growth. Under the NZE, it is likely that we would capture incremental deflation, given the assumed decline in commodity prices.
- Asset Valuations and Impairments: We screened our long-lived assets for potential impairments under both APS and NZE Scenarios, recognizing neither scenario is consistent with our baseline planning forecast. Under the APS, we believe asset impairments are unlikely. Under the NZE, future impairments are more likely given the extent of potential commodity price declines. The timing and magnitude of such impairments would be determined by the timeframe over which the macro environment deteriorates and our ability to offset commodity price declines through economic enhancement initiatives. This is difficult to model with a high degree of confidence.
- Asset Retirement Obligations and Estimated Useful Lives of Assets: Our asset retirement obligations (AROs) primarily relate to the abandonment of oil and gas producing facilities. We carried a $295 million long-term ARO liability on our balance sheet as of Dec. 31, 2022, equivalent to less than 2% of our net property, plant and equipment (PP&E) on our balance sheet as of Dec. 31, 2022. Notably, our ARO balance is down considerably from the year-end 2016 balance of approximately $1.7 billion due to our success in portfolio optimization. Application of the IEA’s APS assumptions and outputs are not expected to drive any material changes to our current ARO balance (including timing or composition thereof). The lower longer-term commodity prices in the IEA NZE could contribute to an acceleration in estimated retirement dates for certain assets. To estimate the potential impact of the IEA NZE on our ARO, we conducted a high-level sensitivity analysis and assumed the retirement date for all assets was reduced by 10 years. Under these assumptions, our long-term ARO liability could potentially increase by a range of $100 million to $200 million.
Perspective on Scope 3 Emissions
Our GHG and methane intensity objectives are focused on our operated Scope 1 and 2 emissions – the emissions under our control. We believe driving significant reductions to our operated Scope 1 and 2 emissions is the right objective for our company and global consumers of energy.
While we have disclosed our estimated Scope 3 emissions within this report for the sake of transparency, we do not believe our estimated Scope 3 emissions data is material information for our shareholders and we believe the usefulness of Scope 3 data for individual company comparison or performance is compromised by a number of considerations, a few of which we highlight below:
- As an E&P, we do not manufacture products or sell directly to our consumers.
- Scope 3 includes emissions outside of our direct control that can be difficult if not impossible to reduce or even estimate accurately. The oil and natural gas that we produce have a variety of end uses which are ultimately determined by consumer behaviors and economic demand.
- Scope 3 emissions are subject to double counting (or more) across companies and industries.
- Scope 3 disclosure from one company to the next is often inconsistent, incomparable and misleading and therefore can be a poor indicator of a company’s relative climate risk.
- Scope 3 emissions at an individual company level do not provide a holistic view of carbon emissions and therefore provide an incomplete, if not misleading perception of a company’s relative impact on overall GHG emissions. For example, the increased consumption of U.S. natural gas to displace coal increased the Scope 3 emissions of many companies but simultaneously drove tremendous net reductions to GHG emissions in the U.S. electric sector.
- A primary focus on reducing Scope 3 emissions without consideration of global demand trends could have negative consequences for global consumers of energy, energy security and the environment. For example, a specific company-level focus on reduction of Scope 3 emissions notwithstanding end-user demand trends could result in a reduction of domestically produced oil and gas, which could contribute to a shortage of U.S.-produced energy and elevated global oil and gas prices that reduce societal access to energy. Additionally, if U.S.-produced oil and gas is displaced by other sources of global supply, there could be negative environmental consequences. Oil and gas produced in the United States is done so at the highest environmental and regulatory standards and with relatively lower GHG intensity when compared to other sources of global production. One could argue that growth in U.S. oil and gas production should be encouraged, given its favorable environmental footprint and should be the preferred supply source to meet global oil and gas demand, though such growth could potentially increase Scope 3 emissions for the U.S. sector.
How are we doing?
Your opinion matters. Please take a moment to let us know how useful you find the content on this page.
If you’d like to give us your feedback on the entire report, please fill out the complete survey for the 2022 report.